Google Lighthouse is freely accessible software that checks and ameliorates the global functioning of web pages and apps. It stands as one of the most popular helping tools made available by Google to web developers. Especially since the latest major update to the 9.0 version in 2021, it wouldn’t be exaggerated to label the measurements as high fidelity. In fact, what we got is an entire toolbox capable of evaluating almost any facet of website performance. From load speed to SEO, along with the main components of user experience, auditing with Lighthouse becomes a walk in the park. The score delivered is also included in the PageSpeed Insights.
The main reason why we are mentioning this is the presence of numerous PageSpeed Insights vs Lighthouse comparatives across the web. We would rather say that they are complementary. The former is more on the diagnostic side whereas the latter seems a little more treatment-oriented.
So how to read a Lighthouse report properly and make the best of it? That’s what our article will reveal. Or, in other words, you will find out what Lighthouse reveals about your pages’ performance, accessibility, practices, SEO- and PWA affinities.
A Note on Visual Aspects
Before starting, we would like to underline the reader-friendly characteristics of a Lighthouse report. Thanks to its system of colors, you get an overall impression of your Lighthouse metrics at a glance. This can be extremely time-saving by allowing you to focus on the most urgent aspects. Given that the system has a scoring range between 0 and 100, here’s the significance of the respective colors:
- Green goes from 90 to 100 and means ‘Good’.
- Orange goes from 50 to 89 and means ‘Needs Improvement’.
- Red goes from 0 to 49 and means ‘Poor’.
Now we are ready for a deeper analysis of the metrics.

Performance
Once you have run an audit, performance is the first general metric displayed. It’s mostly about an investigation of the load time. Along with that, there’s an analysis of the potential experience that visitors have with the interface. Namely, the user experience. As said before, the Lighthouse performance scoring range is from 0 to 100. So any of the URLs submitted to the system gets a score in between. This global performance score is also broken down into 6 ‘subscores’, so to speak. These are expressed in seconds and milliseconds (except for CLS) and reflect the following finer details:

First Contentful Paint (FCP)
In simple terms, this is the amount of time that takes for the browser to deliver the first content to a visitor. The ideal FCP should be of 1.8 seconds or less. Those of 3 seconds and above should be remediated. One of the particularities of this score is that, unlike others, it doesn’t really affect the visitors’ manifest perception. It’s nevertheless one of the core indicators of performance. FCP represents 10% of the Lighthouse score for performance.

Speed Index (SI)
This one measures how fast a page is loaded above the fold. Here the layman users are also involved because they can clearly sense the time needed before they see the page content. A Speed Index score of 3.8 seconds or less is fine. If it equals 5.8 seconds or goes beyond, it should be remediated. SI represents 10% of the performance score.

Largest Contentful Paint (LCP)
LCP informs about the time passed before the largest element of a page is loaded. 2.5 seconds or less is a good score. If it takes more, it can become problematic, especially regarding the user experience. Indeed, visitors will probably not fail at noticing a big ‘hole’ amid the content. LCP represents 25% of the performance score.

Time to Interactive (TTI)
TTI shows the time that a page needs before becoming fluidly interactive. Good TTI should be equal to or less than 2.47 seconds. If it takes more than 3.28, improvement is required. TTI represents another 10% of the performance score.
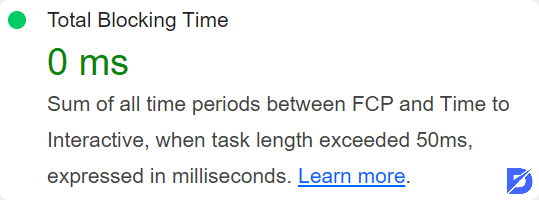
Total Blocking Time (TBT)
TBT is one of the essential scores of a Lighthouse report in terms of load responsiveness. It represents the elapsed time between FCP and TTI. Basically, it’s the period during which the users can’t interact with the page, hence the term ‘blocking’. Website owners should aim for a TBT of less than 300 milliseconds. TBT represents 30% of the performance score.

Cumulative Layout Shift (CLS)
CLS is here to give a precise idea about the visual stability of a page. The meaning of a shift or instability is that the site doesn’t respond according to the user’s expectations. So it’s best to keep it at bay; that is, less than 0.1. This score is the product of the impact fraction and the distance fraction. To keep it simple, let’s just say that both of those measures examine the relationship between unstable elements and the viewport. CLS represents 15% of the performance score.
Recommendation to Improve Performance
Each and every audit is unique, even when conducted on the same page. So neither the scores nor the recommendations will be identical all the time. Nevertheless, there are some common troubleshooting tips provided by Lighthouse when it comes to performance. One example is ‘serve images in next-gen formats’. What Google suggests here is to favor formats with better compression and quality than the ‘traditional’ GIF, JPEG, or PNG. The objective is also to make your content match different devices and screens. Another frequent recommendation is to enable browsers to cache the larger files of the website. The rationale is that stored copies can save time in terms of load, especially for recurrent visits.
You have probably noticed two sections, which are respectively Opportunities and Diagnostics. The difference between them is minimal. The first one is used to measure page load times and other page-related aspects. The second one rather focuses on the performance of your application.
Now, here’s an important thing to keep in mind for any Lighthouse report. The system simply makes some propositions and provides saving estimations (in seconds) without guaranteeing 100% any result. In other words, there’s no need to follow blindly those recommendations like a bible. So instead of relying only on Lighthouse, it’s always better to double-check with additional reliable sources. It doesn’t mean that Lighthouse is weak, inaccurate, or whatnot. It’s just that web development is always multifaceted, often requiring cross-comparisons and a holistic yet individualized approach.
Accessibility
Here’s another crucial aspect of the open-source Lighthouse tool. Simply put, the accessibility score shows how inclusive your page or app is (or not). The concept of inclusivity here mostly refers to users diagnosed with visual impairments. First of all, Lighthouse checks whether your content is in compliance with the Web Content Accessibility Guidelines (WCAG). It also assesses to which extent you are adhering to the Web Accessibility Initiative – Accessible Rich Internet Applications Suite (WAI-ARIA). One essential criterion is a reasonable variety of colors with sufficient contrast. We may also cite the use of NVDA (non-visual access) and the availability of alt tags for images and graphics. Here again, the audit will give you a score out of 100.
As for the recommendations, they will essentially be about your site’s level of ‘qualification’ regarding assistive technologies.

Best Practices
Your pages may have been successful in the Lighthouse speed test and accessibility analysis. The investigation is not over for all that. The third score of the Lighthouse report tells how well you are doing with web practices. For example, are you using secure database connections? Are there any threats to the JavaScript libraries? By the way, have you made sure to finally adopt HTTPS? You get the picture: This part of the audit is mostly based on such questions. It encompasses a total of 16 best practices that determine a score out of 100.
Pretty logically, the recommendations are also closely related to the 16 practices in question. For example, you may get some feedback like ‘Links to cross-origin destinations are unsafe.’ The focal points are security and compliance with the latest standards.
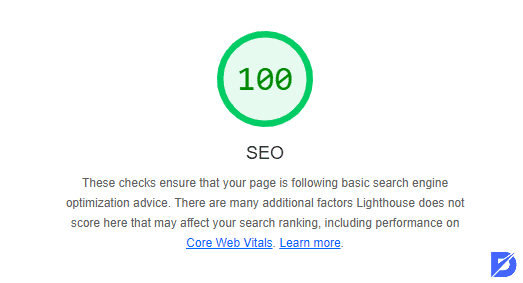
SEO
Who could forget Search Engine Optimization? Certainly not Google. Indeed, the Lighthouse SEO score can give you valuable insight for no less than 13 components. Titles, meta descriptions, canonical tags, crawlability, are the first ones coming to mind. In fact, this score is probably the most indissociable one from your optimization efforts. You get essential hints about your indexing potential by search engines and thus your chances to rank decently on results pages.
When it comes to recommendations, Lighthouse may warn you for example against a lack of meta descriptions. Needless to say, search engines do appreciate appropriate summaries of page content. Font size is another element often listed among SEO issues. Website/app developers should indeed make their best to render material that remains readable on any type of device. So mobile-friendliness is one of the priorities here.
It would be wise to note that this Lighthouse indicator does not replace a distinct and full-fledged SEO audit.
Progressive Web App (PWA)
This final target of the audit wraps up the Lighthouse report. Did you know that it was the foundation of the whole system when Lighthouse was first launched? What basically happens here is that your site is evaluated in relation to PWA norms. For example, is your content available offline too? Have you thought about enabling push notifications? What about your web manifest file? A bunch of questions to consider, among others.
Here again, the recommendations will underline PWA-related issues. At least you will have a global idea about the eligibility criteria.
Conclusion On Lighthouse Reports
A Lighthouse report is like a medical record for your web pages and apps. It provides you with an extensive analysis of major elements that contribute to effective web development. Meanwhile, you also receive guidance about the solutions to implement. The only big disadvantage is the URL-based evaluation instead of a more global one. All in all, what we suggest is to integrate it into your arsenal alongside other auditing tools. Indeed, a mindset based on complementarity and flexibility can help you build and maintain a website at the forefront.
Frequently Asked Questions About
You may consider it as a history of audits. More precisely, it lists the details of audits for which you have completed the suggested tasks.
It’s better to treat it as a roadmap that gives you some directions for the future. No tool can be enough on its own to solve technical issues instantly.
If there’s anything unclear in the report, don’t hesitate to seek assistance. There are field experts who may guide you or take care of some manipulations on your behalf.
There are several ways to run Lighthouse: in Chrome DevTools, from the command line, as a Node module, or from a web UI. We suggest you follow the instructions on the official page: https://developers.google.com/web/tools/lighthouse
Not necessarily, although Core Web Vitals delivers more realistic scores that rely on real user data. They vary from each other in terms of metrics and thresholds. In other words, they don’t exactly evaluate the same things and their respective criteria are somewhat different. So here again, we tend to conclude that it’s rather a matter of complementarity between instruments.


No comments to show.