In the fast-paced digital world, where user experience is paramount, website performance is crucial in determining success. Users expect websites to load quickly and seamlessly, and search engines like Google prioritize fast-loading sites in their rankings. To help web developers and site owners optimize their websites, Google provides a powerful tool called Google PageSpeed Insights. In this comprehensive guide, we will explore more about this tool, how to use it, understand it, its importance and effect on SEO, and discuss its alternatives as well.
But first, let us explain what Google PageSpeed Insights is.
What Is Google PageSpeed Insights?
Google PageSpeed Insights is a free tool from Google that analyzes website performance. It helps site owners and developers optimize page load speed and overall performance for both mobile and desktop devices. The tool assigns a score between 0 and 100, where a higher score means better speed and efficiency. In addition to providing this score, it offers helpful suggestions to improve your site’s performance. You can quickly check your site using a website speed test.
So, how does it work, and how can you use it to get the best results? Let’s explore further.
How to Use the Google PageSpeed Insights Tool
Using Google PageSpeed Insights is simple. All you need to do is enter a URL and interpret the results. Here’s a step-by-step guide to using the tool effectively:
Access Google PageSpeed Insights
Open your browser and go to the Google PageSpeed Insights website. You can access it by:
- Visiting the site directly:
(https://developers.google.com/speed/pagespeed/insights/)
- Searching “Google PageSpeed Insights” or “Google PSI” in any search engine.
Enter the URL
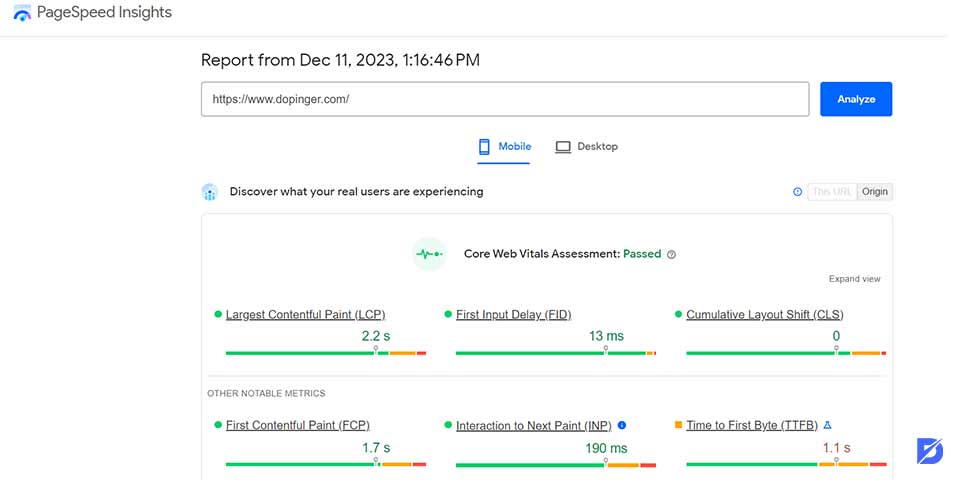
On the PageSpeed Insights page, you’ll see a field where you can enter the web page URL you want to analyze. Simply type or paste the address into the field.
Analyze
After entering the URL, click “Analyze.” Google PageSpeed Insights will begin evaluating the page for both mobile and desktop performance.
Review the Results
Once the analysis is complete, a detailed report will display various metrics and recommendations. These insights cover different aspects of your website’s performance.
Understand the Analysis Outcome
You will be exposed to various metrics with a page score of these metrics:
- Performance Score: The report’s top displays the overall performance score, ranging from 0 to 100. A higher score indicates better performance.
- Field Data and Lab Data: PageSpeed Insights provides both field data (actual user experiences) and lab data (simulated experiences). Pay attention to both perspectives for a comprehensive understanding of your website’s performance.
- Opportunities: This section outlines specific opportunities for improvement, such as optimizing images, leveraging browser caching, or eliminating render-blocking resources.
- Diagnostics: The Diagnostics section provides additional information on various aspects, including accessibility, SEO, and best practices.
Implement Recommendations
Opportunities and Diagnostics sections are a good start to identify areas for improvement. Details accompany each recommendation on how to address the issue. Prioritize and implement these recommendations to enhance your website performance.
Test Again
After implementing the changes, rerun the analysis using Google PageSpeed Insights to see if your optimizations made a difference and to identify any further opportunities.
Additional Tips
- Compare Different Pages: Analyze different pages on your website to spot trends and prioritize performance improvements.
- Learn Core Web Vitals: Understand key metrics like Largest Contentful Paint (LCP), Cumulative Layout Shift (CLS), and First Input Delay (FID) to assess user experience.
- Use Chrome DevTools: For a deeper analysis, try Chrome DevTools to evaluate and profile page load performance in detail.
By following these steps and using Google PageSpeed Insights regularly, you’ll improve your website’s performance, boost user experience, and optimize your site for both desktop and mobile visitors.
Understanding Your PSI Report
Understanding your Google PageSpeed Insights (PSI) report is key to optimizing your website performance. A Google PSI report provides a detailed breakdown of your webpage, highlighting its strengths and areas needing improvement. Let’s look at the key elements you’ll find in a typical report:
Performance Score
The Performance Score is a number between 0 and 100 that shows how well your site performs. A higher score means better performance.
How to interpret it? Scores fall into three categories:
- Poor: 0-49
- Needs Improvement: 50-89
- Good: 90-100
Aim for a higher score to boost your page’s speed and improve user experience.
Field Data (Core Web Vital Assessment)
Field data refers to real-world performance metrics collected from actual users visiting your site. It’s part of the Core Web Vitals, which Google considers essential for measuring user experience.
The three key Core Web Vitals are:
- Largest Contentful Paint (LCP): Measures how long it takes for the largest content element (like an image or text block) to appear on the screen. Faster LCP means users see content sooner.
- Cumulative Layout Shift (CLS): Measures unexpected shifts in layout during loading, which can disrupt the visual stability of your page. A low CLS ensures a more stable, less frustrating experience.
- First Input Delay (FID): Measures how quickly your site responds to the first user interaction, like a click or tap. A low FID means your site is more responsive.
Core Web Vitals are crucial for understanding how real users interact with your site, helping you identify areas that need improvement. Google uses this data to assess the overall user experience, which affects your rankings.
Lab Data
In Google PageSpeed Insights, Lab Data refers to performance metrics generated in controlled environments, unlike Field Data, which comes from real user experiences. Lab data helps developers and site owners assess specific aspects of a webpage’s performance under ideal conditions. Tools like Lighthouse simulate performance to give insights into how a webpage behaves when everything is optimized.
Let’s look at the key aspects of Lab Data in Google PageSpeed Insights:
Controlled Environment
Lab data is collected in controlled settings, making it consistent and repeatable. This helps developers address performance issues without the variables seen in real-world scenarios, like device differences or network speed.
Consistency
Because lab data removes variations caused by external factors (like network conditions or user behavior), it ensures consistent performance metrics, which are crucial for diagnosing issues.
Key Metrics
Lab data includes important performance metrics such as:
- FCP (First Contentful Paint): Time it takes for the first content to appear on the screen.
- LCP (Largest Contentful Paint): Time it takes for the largest visible content to load.
- CLS (Cumulative Layout Shift): Measures unexpected shifts in layout during page load.
- TBT (Total Blocking Time): Time the page is blocked and unresponsive to user input.
Lighthouse Tool
The Lighthouse tool generates Lab Data for Google PageSpeed Insights. Lighthouse is an open-source tool that runs automated tests to evaluate page speed and overall performance, providing actionable recommendations to improve your site.
Simulated Scenarios
Lab data is valuable for simulating different scenarios—like varying network speeds or device types—so developers can see how their site performs under various conditions.
Combining both Lab Data and Field Data gives a more complete view of your site’s performance. Lab data is great for identifying specific issues in a controlled setting, but Field Data shows how your site performs in the real world, taking into account user behavior, device diversity, and network variability.
Opportunities & Diagnostics
When analyzing your website through Google PageSpeed Insights, two key sections to focus on are Opportunities and Diagnostics. These sections provide insights into areas where performance can be improved and highlight any additional technical aspects affecting your site’s speed and user experience.
Opportunities
In the Opportunities section, you’ll find areas where your webpage can be optimized for better performance. These typically include suggestions like compressing images, eliminating render-blocking resources, or enabling browser caching. Addressing these issues can significantly improve page load times and overall user experience.
Each opportunity comes with detailed recommendations, making it easier to prioritize and implement the necessary changes to boost your website’s speed and efficiency.
Diagnostics
The Diagnostics section provides additional technical insights about your site’s performance, focusing on areas like accessibility, SEO optimization, and adherence to web development best practices. This section doesn’t directly affect your performance score, but it’s crucial for ensuring your site follows recommended standards.
Carefully reviewing the diagnostics helps ensure your webpage complies with accessibility requirements and SEO best practices, improving both user experience and search engine rankings.
Passed Audits
The Passed Audits section shows a list of performance checks your page has successfully passed.
What are these audits? Google PageSpeed Insights runs a variety of audits to assess a webpage’s overall performance, focusing on factors that affect speed and user experience. These audits evolve over time as Google updates its tools and algorithms.
Some common audits included in a PSI report are:
- First Meaningful Paint (FMP): Measures when the primary content becomes visible to users.
- Speed Index: Evaluates how quickly the content on a page is visually completed during loading.
- Time to Interactive (TTI): Assesses how long it takes for the page to become fully interactive for users.
- Total Blocking Time (TBT): Measures the total time the page remains unresponsive to user input.
- First CPU Idle: Tracks when the page becomes minimally interactive.
- Max Potential First Input Delay: Estimates the longest delay users might experience before interacting with the page.
- Avoids Excessive DOM Size: Ensures that the Document Object Model (DOM) size is within acceptable limits.
- Minimize Main-Thread Work: Assesses how much work is being done on the main thread during page load.
- Optimize Images: Provides recommendations to compress and load images more efficiently.
- Efficiently Encode Images: Checks whether images are encoded in optimal formats.
- Defer Offscreen Images: Suggests deferring the loading of images that aren’t immediately visible to users.
- Serve Images in Next-Gen Formats: Recommends using modern, efficient formats like WebP to serve images.
Remember, Google frequently updates its tools and algorithms, so staying up-to-date with the latest developments is crucial. Implementing the recommended actions from these audits can significantly improve your site’s performance and user experience.
How Does My Google PageSpeed Insights Score Affect SEO?
Your Google PageSpeed Insights (PSI) score can significantly impact your website’s SEO. While Google has confirmed that page speed is a ranking factor, the relationship between PSI scores and search rankings can be complex. Let’s explore how your PSI score influences your site’s SEO.
Search Ranking Factor
Google uses page speed as one of the factors when ranking websites. Pages that load quickly are often favored because they provide a better user experience, helping to improve your search rankings.
User Experience and Bounce Rates
Slow-loading websites tend to have higher bounce rates, as users are more likely to leave a page that takes too long to load. High bounce rates signal to search engines that your content may not be relevant, potentially lowering your rankings.
Mobile-First Indexing
With Google’s shift to mobile-first indexing, the speed and performance of your mobile site are critical. A strong PSI score for both mobile and desktop versions of your site is essential for maintaining or improving your SEO performance.
Crawl Budget
Google assigns a crawl budget to every website, determining how much of your site it can crawl and how often. Faster-loading pages use the crawl budget more efficiently, ensuring that more of your content is indexed by search engines.
Mobile-Friendly Ranking Factor
Google also considers mobile-friendliness as a ranking factor, with page speed being an important component of providing a positive mobile experience. A high PSI score helps ensure your site is mobile-friendly, which boosts your ranking. Use tools like our Mobile-Friendly Test to check your site.
Featured Snippets
Pages that load faster may have a better chance of appearing in featured snippets, the highlighted results at the top of search engine results pages. Being featured can increase your site’s visibility and drive more traffic.
Competitive Advantage
A faster website gives you a competitive edge. Users are more likely to engage with sites that load quickly, meaning a high PSI score can help you outperform competitors who have slower websites.
How to Improve Your Google PageSpeed Insights Score
As we’ve discussed, speed is crucial for both website performance and SEO optimization. Improving your Google PSI score is an important step in enhancing your site’s speed and visibility. Here are a few things to keep in mind:
- Don’t aim for a perfect 100/100 score. Instead, focus on gradually improving your site’s overall performance.
- A very low score may indicate a deeper technical issue that might need professional attention.
Now, let’s explore how to improve your PageSpeed Insights score.
Serve Image in Next-Gen Formats
Compressing images and using modern formats like WebP or AVIF can significantly improve your site’s loading speed. Google recommends converting older formats (such as JPG or PNG) to these newer formats to boost performance.
- WebP: Introduced by Google in 2010, this format offers superior compression for both lossless and lossy images.
- AVIF: An open-source format that supports both still and animated images, known for its high compression efficiency.
Preload Key Requests
Fixing preload key requests is crucial because it allows your browser to load critical resources before the user interacts with your site. This improves web performance by reducing load times, which directly impacts SEO optimization and user experience, especially in metrics like LCP (Largest Contentful Paint) and FCP (First Contentful Paint).
To fix preload key requests, you first need to identify which resources need preloading. Tools like Lighthouse can help you do this. Once identified, follow these steps to preload critical resources:
For HTML tags:
<link rel="preload" as="script" href="your-script.js"><link rel="preload" as="style" href="your-stylesheet.css"><link rel="preload" as="font" type="font/woff2" crossorigin="anonymous" href="your-font.woff2">- Make sure to specify the correct resource type:
- JavaScript:
as="script" - Stylesheets:
as="style" - Fonts:
as="font" - If resources are hosted on another domain, add
crossorigin="anonymous"to avoid any issues. - Defer non-critical requests while prioritizing the critical ones to improve loading performance.
Finally, test your site again using Google PageSpeed Insights or Lighthouse to ensure everything is working correctly. Keep in mind that ongoing performance reviews are necessary to maintain optimal results.

Minify CSS
CSS plays an important role in web design, but large CSS files can slow down page load times, negatively impacting speed and increasing bounce rates. Minifying CSS removes unnecessary characters and spaces from your stylesheets, making them smaller and faster to load without affecting how your site looks.
Here are two ways to minify CSS:
Manual Minification:
Follow these steps to manually reduce CSS file size:
- Remove unnecessary spaces, tabs, and line breaks from your CSS code.
- Delete any comments in the CSS files.
- Shorten hex color values (e.g., from six digits to three where possible).
- Use shorthand properties to reduce the length of your CSS code.
Automated Minification:
For larger projects, automated tools are more efficient. You can:
- Use online tools to copy and paste your CSS, which will generate a minified version.
- Integrate minification into your build process with tools like CSSnano and PostCSS.
- Use build tools that automate the minification process as part of your development workflow.
By reducing CSS file size, you can improve page load speed, which enhances both user experience and SEO performance.
Reduce Server Response Times (TTFB)
Server response time refers to how long it takes your server to respond to a user’s request. Reducing Time to First Byte (TTFB) is critical for improving both website performance and user experience. Here are some effective ways to reduce server response times:
You may also consider using a caching mechanism for static data or frequently accessed data.
- Optimize database queries: Use indexes for faster lookups, avoid complex or unnecessary queries.
- Implement caching: Use caching mechanisms for static or frequently accessed data.
- Use a Content Delivery Network (CDN): Distribute your content across multiple servers worldwide to reduce the physical distance between server and user.
- Enable compression: Compress files to reduce the amount of data transferred.
- Minimize HTTP requests: Reduce the number of elements on a page, such as scripts, images, and stylesheets.
- Optimize images: Reduce image file sizes without sacrificing quality using image compression tools.
- Leverage browser caching: Store static files on the user’s device to reduce the need for redownloading on subsequent visits.
- Use server-side caching: Cache frequently requested data or HTML responses on the server.
- Upgrade your hosting: Move to a dedicated or virtual private server (VPS) for improved response times.
- Load balancing: Distribute traffic across multiple servers to prevent bottlenecks.
- Optimize server-side code: Remove unnecessary code and use efficient algorithms.
- Reduce server processing: Offload tasks to background processes or use serverless computing.
- Use a high-performance web server: Servers like Nginx or LiteSpeed handle more connections and deliver content faster than traditional servers.
By implementing these strategies, you’ll improve both page load times and user experience, which can also boost your SEO rankings.
Avoid Multiple Page Redirects
Redirects can slow down your site’s loading time and negatively impact the user experience. Here are a few strategies to avoid multiple redirects and improve your site’s performance:
Here we have a few alternatives;
- Link directly to the final destination whenever possible to avoid unnecessary redirects.
- Update internal links regularly to ensure they point directly to the correct pages.
- Audit and fix broken links on your site, as broken links often lead to unnecessary redirects.
- Check external links frequently to ensure they are up-to-date and functioning correctly.
- Use relative paths for internal resources instead of absolute paths when possible.
- Use 301 redirects for permanent URL changes to ensure search engines recognize the new location.
- Set caching headers to instruct browsers to cache redirects for faster performance.
- Avoid redirect chains by ensuring that any redirects are as direct as possible, reducing latency.
- Optimize server configuration to efficiently handle redirects.
- Minimize redirects between mobile and desktop versions, and consider using responsive design to avoid this issue altogether.
- Monitor your site for unexpected redirects regularly with tools like browser development tools or performance testing tools.
By reducing redirects, you can improve site performance, reduce load times, and enhance SEO.
Efficiently Encode Images
Efficiently encoding images is key to balancing file size and visual quality, which improves both website performance and user experience. Here’s how you can optimize your images:
- Choose the right format for your image:
- JPEG: Ideal for photographs and images with gradients.
- PNG: Best for images with transparency and sharp edges.
- WebP: Modern format offering great compression and quality, perfect for web use.
- Optimize image dimensions: Avoid loading larger images and resizing them with HTML or CSS, as this increases bandwidth usage and slows down your site.
- Compress images: Use tools like ImageOptim, TinyPNG, or JPEGoptim to reduce file sizes without compromising quality.
- Use progressive JPEGs: These load in stages, showing a low-resolution version quickly before fully loading in higher resolution.
- Set caching headers: Instruct browsers to cache images, reducing the need to download them again on repeated visits.
- Use image sprites: Combine multiple images into one file to reduce HTTP requests and improve loading times.
- Implement lazy loading: Load images only when they enter the viewport to reduce initial load times.
- Serve next-gen formats: Use formats like WebP or AVIF for better compression and quality if supported by the browser.
- Responsive images: Use the srcset attribute in HTML to serve different image sizes based on the user’s device or screen resolution.
- Use SVGs: For simple graphics, SVGs are ideal since they can be scaled without losing quality.
- Remove unnecessary metadata: Strip metadata from images to reduce file size.
- Automate image optimization: Use tools like ImageMagick and OptiPNG to automate the process.
By following these steps, you’ll improve both loading times and overall user experience on your site.
Avoid Chaining Critical Requests
Chaining critical requests happens when resources like CSS, JavaScript, and fonts depend on each other, delaying the rendering of your webpage. This negatively affects page load speed, especially for above-the-fold content.
To avoid this and improve loading speed, follow these steps:
- Minimize and optimize CSS: Reduce the size of your CSS files for faster loading.
- Load critical CSS inline: Place essential CSS directly in your HTML to prioritize loading.
- Prioritize above-the-fold content: Ensure that content visible to users without scrolling loads first.
- Load non-critical JavaScript asynchronously: Use the async attribute to prevent non-essential scripts from blocking rendering.
- Defer non-essential JavaScript: Use the defer attribute or place scripts at the end of the HTML to load them after the main content.
- Optimize web fonts: Compress and preload web fonts to speed up rendering.
- Preload critical resources: Preload resources like fonts and images to ensure they are available immediately.
- Use a CDN: A Content Delivery Network reduces latency by serving resources from the server closest to the user.
- Optimize images: Compress and resize images for faster loading.
- Reduce the number of requests: Combine files or reduce elements that require multiple requests to the server.
By reducing critical request chains, you’ll see improvements in page load speed and user experience.
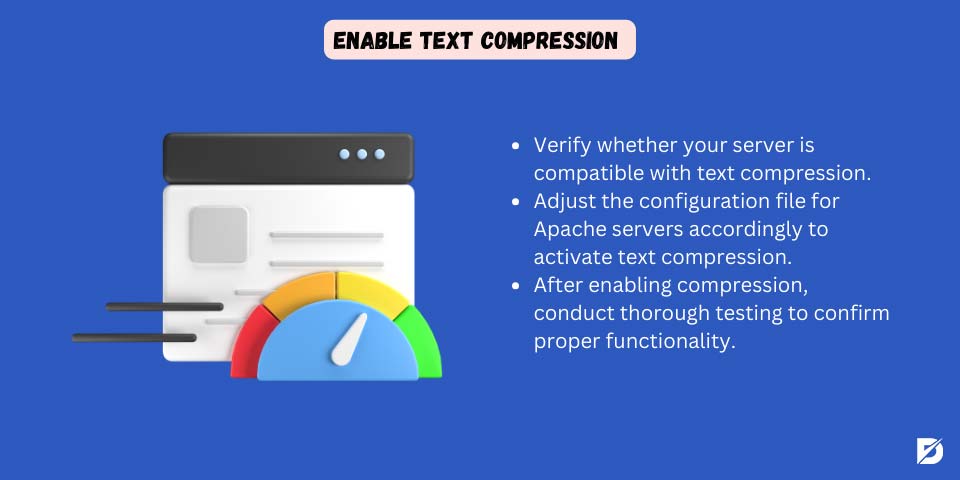
Enable Text Compression
Text compression reduces file sizes and improves loading times by compressing content before it’s sent to the browser. Like image compression, it optimizes load times without sacrificing quality, leading to a better user experience.
Here’s how to enable text compression:
- Check if your server supports compression: Most modern web servers have built-in support for text compression.
- Configure your server:
- Apache: Modify the server configuration file to enable text compression.
- IIS (Internet Information Services): Enable compression through IIS Manager:
- Open IIS Manager.
- Navigate to your site.
- Under the “IIS” section, open Compression.
- Enable both dynamic and static compression as needed.
- Test the setup: After enabling text compression, run performance tests using tools like Google PageSpeed Insights to ensure it’s working properly.
By enabling text compression, you’ll enhance both website performance and user experience.
Use Video Formats for Animated Content
If your webpage uses GIFs, APNG, or SVG animations, replacing these with video formats can greatly enhance loading speed and performance. Here’s how to transition your animated content into video format:
- Create or select animations: If you don’t already have animated content, design it using graphic software or use pre-made animations.
- Choose the appropriate video format:
- MP4 (H.264): Most widely supported across browsers.
- WebM (VP9) or OGG (Theora): Also common video formats for the web.
- Convert animations to video: Use video editing tools or online converters like HandBrake or FFmpeg to compress and export your animated content to the chosen video format.
- Compress the video: Optimize it for the web to ensure fast loading without compromising quality.
- Embed the video: Use the HTML
<video>tag to embed the video on your page, adjusting the width, height, and other attributes as needed. - Provide fallback content: In case the browser doesn’t support the video format or playback is disabled, include alternative content within the
<video>element. - Check browser compatibility: Ensure that your chosen video format is supported by all major browsers.
- Make it responsive: Use CSS to ensure the video adapts to different screen sizes for a better user experience.
- Lazy load videos: Consider using lazy loading techniques to improve initial page load time.
- Test across browsers: Verify that your videos load and play smoothly on all major browsers and devices.
Reduce the Impact of Third-Party Code
Third-party code, such as ads, analytics, or external widgets, can slow down your site’s performance. Reducing the impact of these scripts is key to improving page speed and user experience.
Here are strategies to minimize the impact of third-party code:
- Evaluate and prioritize third-party scripts: Identify all third-party scripts, prioritize based on importance, and remove or replace those that aren’t necessary.
- Load third-party code asynchronously: Use the
asyncattribute to prevent scripts from blocking page rendering. - Defer non-essential scripts: Delay loading non-essential scripts until after the initial page load for faster content delivery.
- Lazy load third-party content: Only load third-party images and widgets when they enter the user’s viewport.
- Optimize third-party images: Compress and resize these images to reduce load times.
- Use CDNs: Leverage Content Delivery Networks (CDNs) to reduce latency for third-party resources.
- Implement Subresource Integrity (SRI): Ensure that third-party scripts haven’t been tampered with, improving security.
- Regularly monitor performance: Use browser tools to track the performance of third-party scripts and their impact.
- Consider server-side solutions: Offload some third-party processes to the server to reduce client-side load times.
- Set caching headers: Allow browsers to cache third-party scripts to prevent repeated downloads.
- Disable unnecessary features: Disable non-essential third-party features to reduce performance impact.
- Self-host critical scripts: Where possible, self-host critical third-party scripts for better control and faster loading times.
Implementing these strategies will improve your site’s performance and reduce the negative effects of third-party code on page load speed.
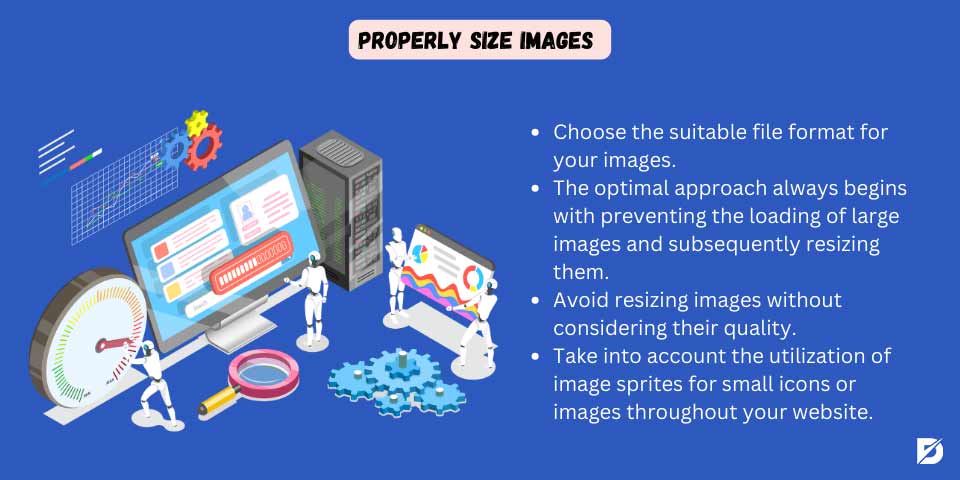
Properly Size Images
This warning concerns image sizes, and it states that the dimension of the image is significantly larger than needed. As we came to know that large images take more time to load; thus it will affect website speed and bounce rate. Therefore, it is essential to solve this issue.
Here, we have provided a few steps to solve it;
- Select the appropriate file format for your images, as we mentioned earlier. Each file type suits a specific need and purpose.
- The best solution always starts by avoiding loading large images and then resizing them. Therefore, it is better to always resize images before uploading to the webpage using various editing software such as Photoshop. Doing so ensures that you’re not forcing the browser to download larger images than necessary.
- Never resize images without taking into consideration their quality. The best way to do it is to compress images so that you will have the required size in the same high quality.
- Implement responsive design techniques to serve different image sizes based on the user’s device and screen resolution. For example, use the `srcset` attribute in the `<img>` tag to provide multiple image sources.
- For devices with Retina displays or high-density screens, provide higher resolution images using the `2x` or `3x` descriptors in the `srcset` attribute.
- Implement lazy loading for images, especially those below the fold. The reason behind using Lazy loading is that it delays loading offscreen images until the user is about to view them, reducing initial page load times.
- To help the browser allocate the correct space for the image before it is fully loaded, always specify the width and height attributes in the `<img>` tag to prevent layout shifts.
- To reduce the need to download the same images on repeated visits and improve overall performance, you should set appropriate caching headers for images to instruct browsers to cache them.
- Consider using image sprites for small icons or images across your site. Combining multiple images into a single sprite reduces the number of HTTP requests.
- Regularly audit your website’s images using Google PageSpeed Insights to monitor changes in image sizes and optimize as needed.
Lighthouse vs Pagespeed insights
Both Lighthouse and Google PageSpeed Insights are Google-provided tools to help developers and website owners assess and improve the performance of their websites. However, they differ in usage scenarios and purposes.
Let us dive into each to see how they are similar and differ from each other;
Type
Lighthouse is an open-source, automated tool for improving web page quality. It’s integrated into Google Chrome. Still, it’s also available as a command-line tool or a Node module.
While, PageSpeed Insights is a web-based tool provided by Google that analyzes the content of a web page and generates suggestions to make that page faster.
Usage
Lighthouse:
- It provides detailed web page audits, including performance, accessibility, SEO, and best practices.
- It can be run directly from the Chrome DevTools, the command line, or programmatically using Node.js.
- Its audits are more detailed and cover a broader range of aspects beyond performance, making it a comprehensive tool for web development.
- In short, it is used for in-depth audits during development, testing, and as part of continuous integration processes.
PageSpeed Insights:
- It analyzes a specific URL and provides insights and recommendations for improvement.
- It’s a user-friendly tool, as it only requires users to enter a URL address and provides desktop and mobile performance scores.
- In short, it is often used for quick, high-level assessments of website performance and user experience.
Features
Lighthouse:
- It includes metrics like First Contentful Paint (FCP), Largest Contentful Paint (LCP), and Cumulative Layout Shift (CLS).
- It offers actionable advice on improving different aspects of a web page based on the audits.
- It generates a comprehensive report with a score for each category, making it a valuable tool for overall website improvement.
PageSpeed Insights:
- It provides a performance score based on Google’s performance metrics.
- It offers suggestions for optimization, including specific issues that may be impacting the page’s performance.
- It provides real user performance metrics and simulated performance metrics. i.e., both field data (real and lab data.
Integration
Lighthouse:
- For manual testing and analysis, it is integrated into Chrome DevTools.
- Automated testing can be used programmatically as part of a continuous integration (CI) pipeline.
PageSpeed Insights:
- It can be accessed through a web interface where users can input a URL for analysis.
- API is available for programmatic access to PageSpeed Insights data.
Scope
Lighthouse:
- It has a more comprehensive tool as it covers various aspects of web development, including performance, accessibility, SEO, and best practices.
PageSpeed Insights:
- It has a more focused scope, focusing on performance and providing actionable insights and recommendations to improve speed.
From analyzing Lighthouse and PageSpeed types, scope, features, integration, and usage, we can conclude that Lighthouse is a versatile, comprehensive tool for detailed website audits. At the same time, PageSpeed Insights is a user-friendly tool that focuses primarily on providing performance insights and recommendations. Therefore, depending on the level of detail and specific requirements of your optimization efforts, you can decide which to use.
Google PageSpeed Insights Tool Alternatives
Google PageSpeed Insights is indeed a popular tool for analyzing website performance, but this does not mean it is the only tool. There are several alternative tools available that provide similar functionalities. For example, the Lighthouse tool, which we have just discussed in terms of similarities and differences.
Below are four more tools that can be useful to know about and use.
GTmetrix
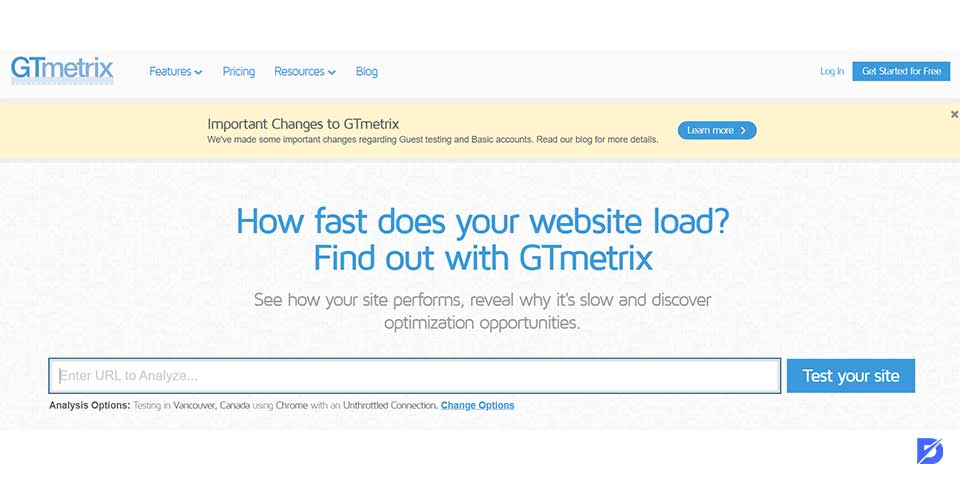
GTmetrix is a web-based comprehensive testing tool that combines Google’s Lighthouse and PageSpeed Insights metrics. It provides detailed reports on various performance aspects, including page load times, optimization scores, and recommendations for improvement.
How to Use It?
It is similar to PageSpeed Insights and is a user-friendly tool; all you need to do is paste the webpage you need to test. In short, all you need to do is;
- Visit the GTmetrix website: [https://gtmetrix.com/](https://gtmetrix.com/).
- Enter the URL of the web page you want to test.
- Click on the “Test your site” button.
- Wait for the analysis to complete.
- Review the detailed report, including scores, metrics, waterfall chart, and recommendations.
It is important to note that GTmetrix is not fully free, as it offers free and paid plans. However, all the essential features are provided in the free plans.
WebPageTest
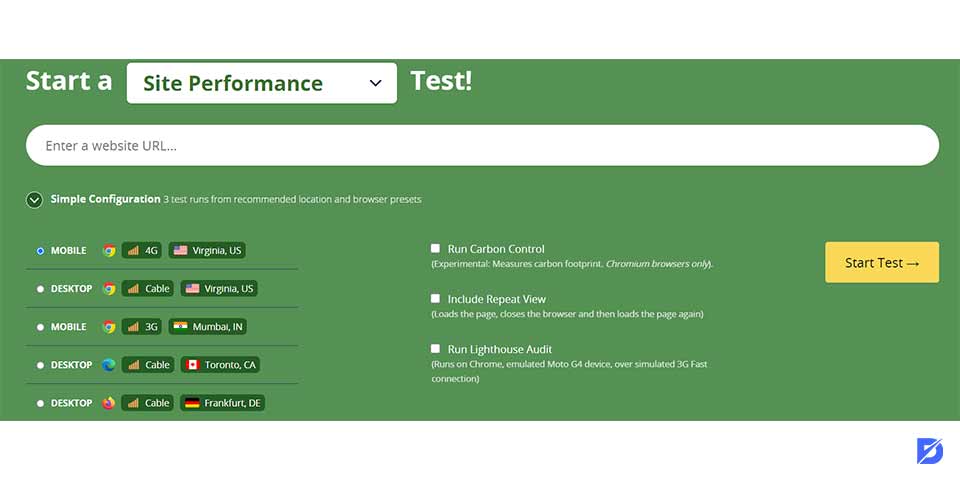
WebPageTest is a free and open-source tool that allows you to run performance tests from multiple locations around the world using real browsers. It provides detailed information about various performance metrics, waterfall charts, and a filmstrip view of the page-loading process. Patrick Meenan developed and maintained this.
How to Use It?
It is also a straightforward tool; all you need to do is:
- Visit www.webpagetest.org.
- Enter the URL for the page you want to test.
- Configure the test settings.
- Start the test.
You will get results with details containing performance scores, metrics, and recommendations for enhancing your website performance and optimization.
Pingdom Website Speed Test
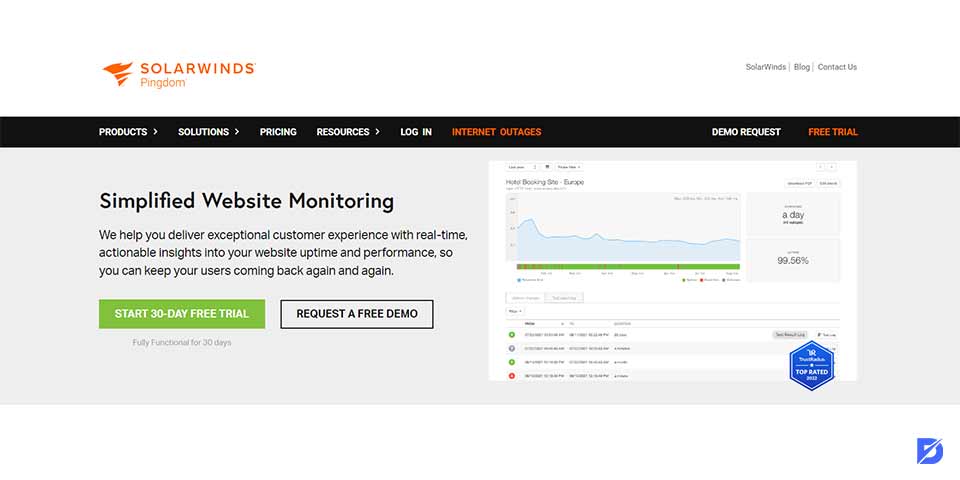
Pingdom is a popular website monitoring service with a Website Speed Test tool. It provides insights into your website’s performance, including load time, page size, and requests. Also, it allows you to test from multiple locations.
Unlike Google PageSpeed Insights, using Pingdom involves many actions.
How to Use It?
- Create a Pingdom Account
- Set Up a Monitoring Check
- Configure Monitoring Settings
- Configure Alerting
- Save and Start Monitoring
- View Monitoring Results
- Analyze Reports and Trends
- Make Optimizations
Upon creating your account, you must choose the best plan that suits your needs. Pingo is not a free tool, but it offers free trials.
Dareboost
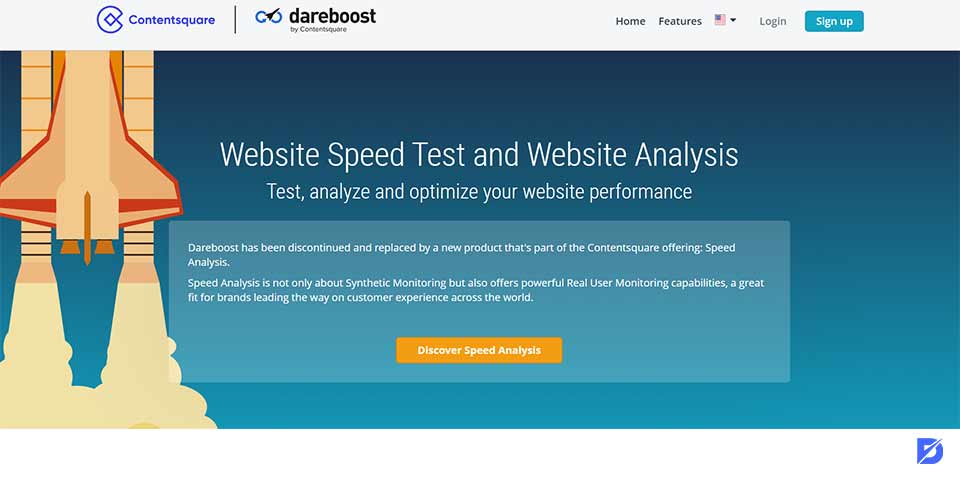
Dareboost is a web performance monitoring and optimization tool that provides a range of features to analyze web performance, identify optimization opportunities, and monitor the ongoing health of websites. Like other tools, it provides insights and recommendations to enhance the speed and user experience.
How to Use It?
- Create an Account.
- Create a new Test.
- Configure Test Settings.
- Run the Test.
- Review the Results.
- Analyze metrics and interpret recommendations.
- Use Historical Data.
- Set up monitoring.
Dareboost is not a free tool, but it provides plans to choose from, and you can try a free trial before choosing a plan.
Final Thoughts
As a web owner, keeping up with ways and tools to check your website performance and enhance it is vital. A high-performance website offers a more desirable user experience, thus a high visitor and customer retention. Many tools provide detailed insight into your page performance, and Google PageSpeed Insights might be the most popular due to its user-friendly usage, detailed reports, and recommendations.
Frequently Asked Questions About
The Chrome User Experience Report provides field data representing real-world performance metrics collected from users who visit your site. This data is based on the browsing experiences of Chrome users and can give insights into your website’s actual performance.
PageSpeed Insights primarily focuses on providing real-time performance analysis. However, you can manually track and compare performance over time by revisiting the tool and saving the results of each analysis.
PSI provides recommendations to optimize your website such as suggestions to optimize images, leverage browser caching, minimize render-blocking resources, and improve server response times.
Regular testing is essential, especially after making significant changes to your website. Because it allows you to identify performance issues, track improvements, and maintain a fast and efficient user experience.
Yes, PSI provides separate scores and recommendations for mobile and desktop versions of your website so that you can assess and optimize accordingly.




No comments to show.