What Is Website Speed Tool?
Website speed tool is a tool used to test how long it takes for your website to open. Dopinger puts various website analysis tools at your disposal. One of these tools is the one where you can test site speed. Site speed may also vary depending on the browser.
To use this tool, simply type your website's URL in the relevant box. Then, the opening speed of your website is determined within a few seconds. At the same time, positive applications that increase page speed on your website are listed. In addition, there is a list of applications and errors that slow down the speed of your site.
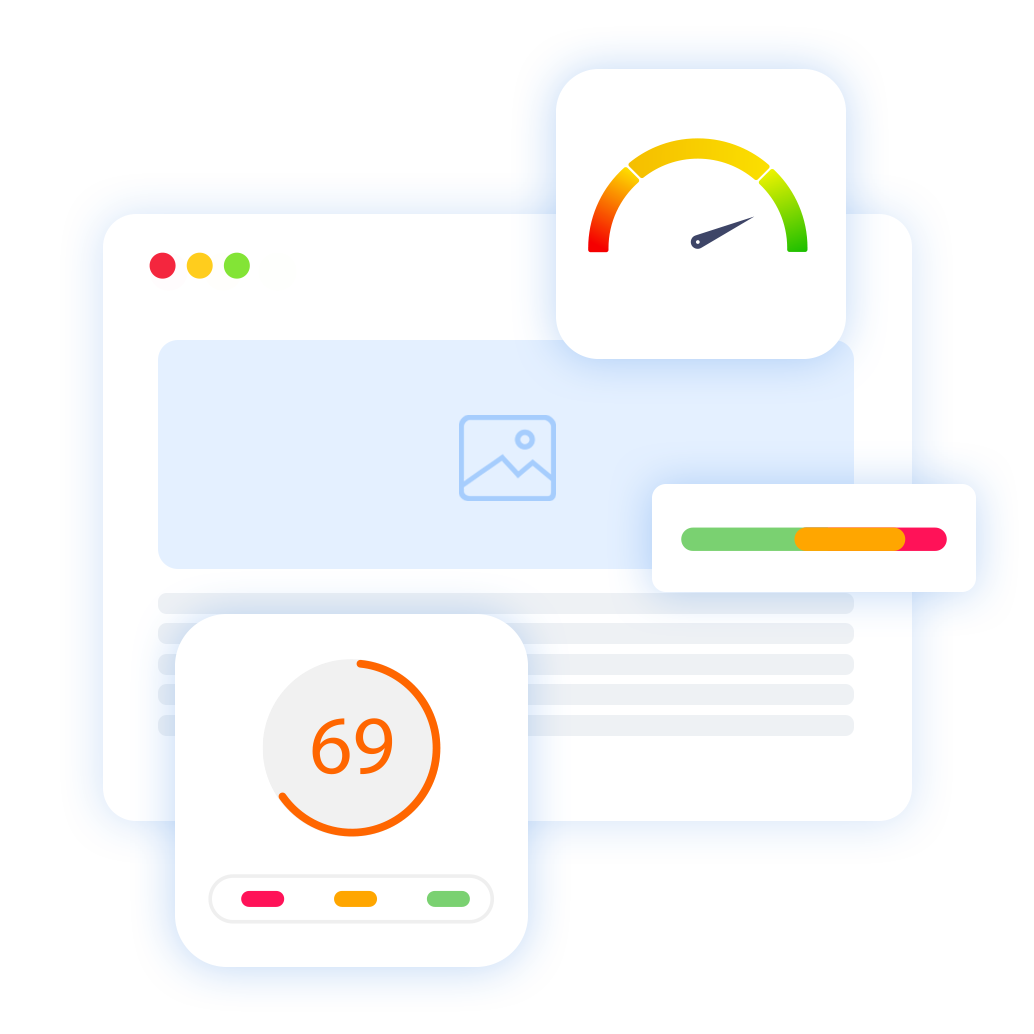
You can measure your page speed for both mobile and desktop devices. Dopinger website speed tool indicates the average number of seconds a page takes to load. It then scores your page's speed performance with a score out of 100.
What Metrics Will You Be able to Test with Dopinger's Website Speed Testing Tool?
Thanks to Dopinger's site speed test tool, you can analyze many terms related to the speed of your website. You will see a list of positive features that increase your website speed and negative practices that slow down your website speed. There is a close relationship between core web vitals metrics and site speed. Therefore, you need to measure the speed of your site.
The analysis tool examines your website on many metrics. It then provides an analysis result about your website for each metric. According to the analysis results, you can track many metrics regarding the speed of your website.
Total Blocking Time
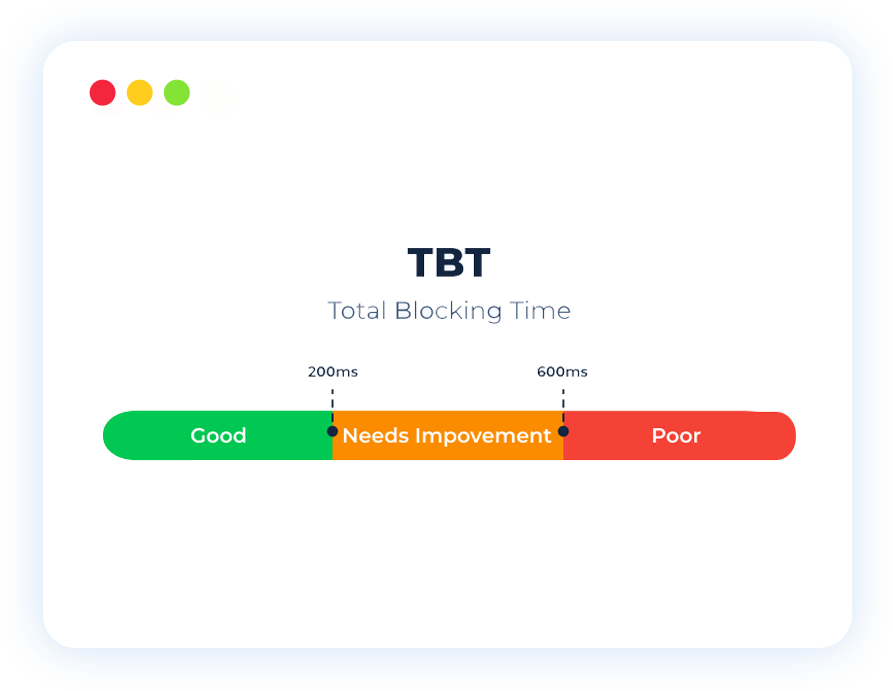
Total blocking time is a site speed performance metric that measures unresponsiveness to user action at the time your web page loads. According to Lighthouse data, total blocking time accounts for 30% of site speed performance.
It measures the total time it takes for a page to block a response to a user's input, such as clicking a mouse, tapping the screen, or pressing a keyboard key. The blocking time for all long tasks between the first rich coloring and the ready-to-interaction time is calculated.
Total blocking time is expressed in milliseconds. Tasks over 50 ms are long. Any value over 50 seconds represents the blocking time. If an 80 ms task is analyzed, you can consider 30 seconds of blocking. The website tester directly measures this metric by taking Google data into account. It is a metric that you must optimize to increase your site speed.
Largest Contentful Paint
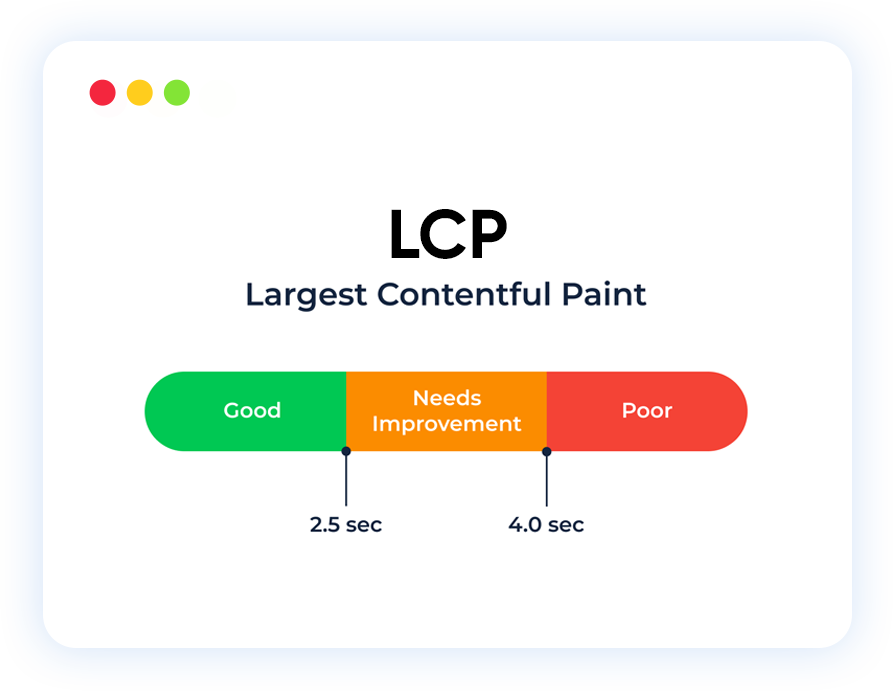
Largest Contentful Paint refers to the time from the time a user requests the URL to the time frame in which the image is displayed until the largest visible content on the web page is displayed.
The largest element on a web page may be an image or video. The largest content on a web page is an important metric for opening the page to the user.
Google identifies the LCP metric as an important user metric. This metric reveals how quickly the user can consume the content on your web page.
When measuring site loading time, largest contetful paint is expressed in seconds. If this time is long, you must optimize the loading time of the largest element to increase page opening.
Cumulative Layout Shift
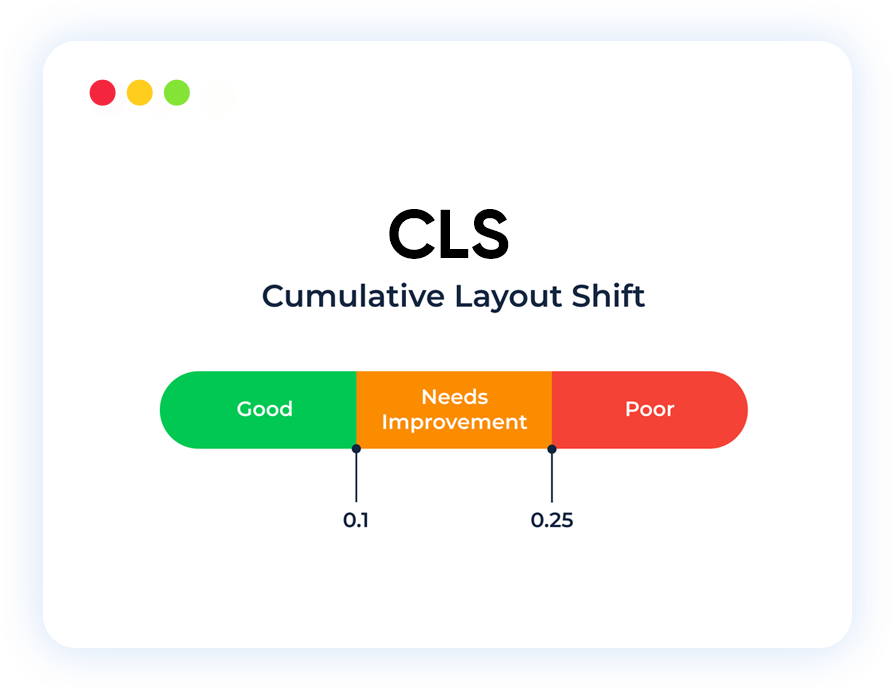
Cumulative layout shifting refers to the flickering, shifting and position change seen in elements such as images, videos and text on your page during the time period when your web page is loaded.
CLS is considered a very important Core Web Vital metric. It needs to be monitored to understand the visual stability on your website. You can prevent if a user experiences unexpected layout shifts.
If the cumulative placement scroll metric is low, your page loading speed will be good. If an unexpected shift occurs, the user experience will be interrupted and your page will load slowly. In this case, the user loses his location and may click on unwanted buttons. If you want to increase site speed, you must follow unexpected shifts and develop optimization strategies in this direction.
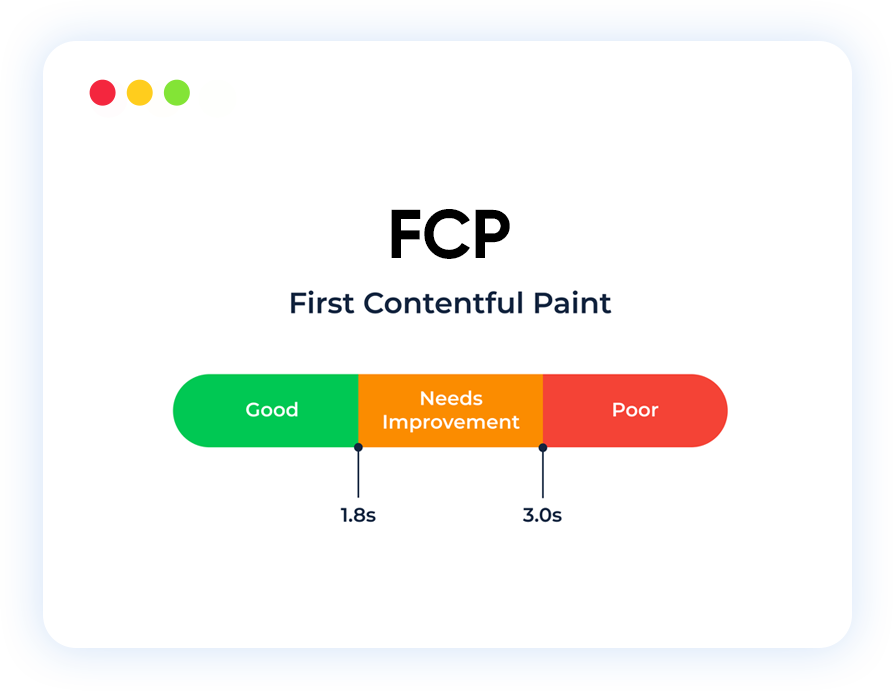
First Contentful Paint
First contentful paint is the metric that shows the time between the moment your web page starts loading and the first element the user sees.
When a user clicks on the link to log in to your website, the first element on the screen should load quickly. The sooner this element loads, the more willing the user is to stay.
The time from the moment the web page is clicked until the first content is displayed is tracked in seconds. If the first item is loaded between 0-2 seconds, this is a good speed value. Between 2-4 seconds the speed is medium and you need to improve. If there is a loading time of more than 4 seconds, this is insufficient and you need to make the necessary adjustments.
Speed Index
The speed index indicates how quickly a web page is visually filled when users click on it. It keeps track of an important element regarding page loading speed.
With the speed index metric, you can track how quickly the content on your web page is visually displayed to the user. This metric measures duration in seconds.
0-3.4 seconds is a good value for the speed index. Between 3.4-5.8 seconds is the average value and some improvements are recommended. Values above 5.8 seconds are slow loading. In this case, you definitely need to take development measures.
Speed index is an important metric in terms of user experience. Take this metric into consideration in your web page speed test and be sure to improve it.
Time to Interactive
Time to interactive is the metric that shows the time it takes for your web page to be fully interactive for the user.
It is a very important metric in determining page speed on your website and making decisions about performance. User interaction is the most important process on the page. Therefore, the Time to interactive metric must be taken into consideration.
The reason this metric is important is because some websites optimize content visibility by foregoing engagement. This practice may negatively impact user experience. It may lead to a situation where the user cannot interact even though the website appears ready.
A value between 0-3.8 seconds is considered sufficient for your website to be fully ready for the user. If it is between 3.9-7.3 seconds, it is medium and it is recommended to improve it. A time to interactive value above 7.3 seconds is considered slow and you should definitely improve this time.
What Can You Do With Website Speed Tool?
Dopinger website speed tool allows you to see the page opening speed performance of your website. This tool gives you an overall score out of 100. Each score range is shown in a different color.
This tool allows you to see the opening speed of your website in both mobile and desktop values. In this way, you can identify the devices you need to improve the speed of your website.
The website speed tool also points out any errors on your website that are slowing down the site speed. You can see what these mistakes are and how they need to be improved. In this way, you can apply applications that will increase the speed of your website.
After the site speed test is performed, the tool allows you to get a report on the site speed. You can download this report in different formats. In this way, you can monitor the speed of your website and save the report. They provide you with a comprehensive report in different formats.
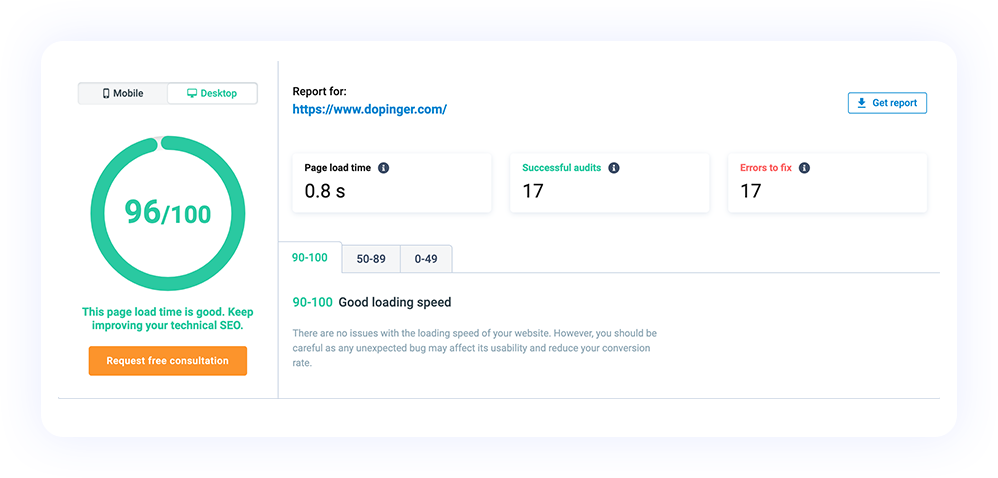
See Your Mobile and Desktop Site Speed Score
The first thing you will see in the Dopinger website speed test results is your website's speed score. The site speed testing tool makes an evaluation by taking all metrics into consideration. It then gives your website a speed score out of 100 based on this evaluation.
In the tool, you will see both mobile and desktop values separately in the site speed score field. The tool scores your website loading speed separately for both mobile and desktop devices.
Scoring out of 100 is evaluated in 3 different categories;
- Scoring between 0-49 is considered slow. You definitely need to optimize your website.
- Scoring between 50-89 is considered medium. It is recommended to optimize your website for better performance.
- A value between 90-100 is considered good. Your website speed is considered sufficient.
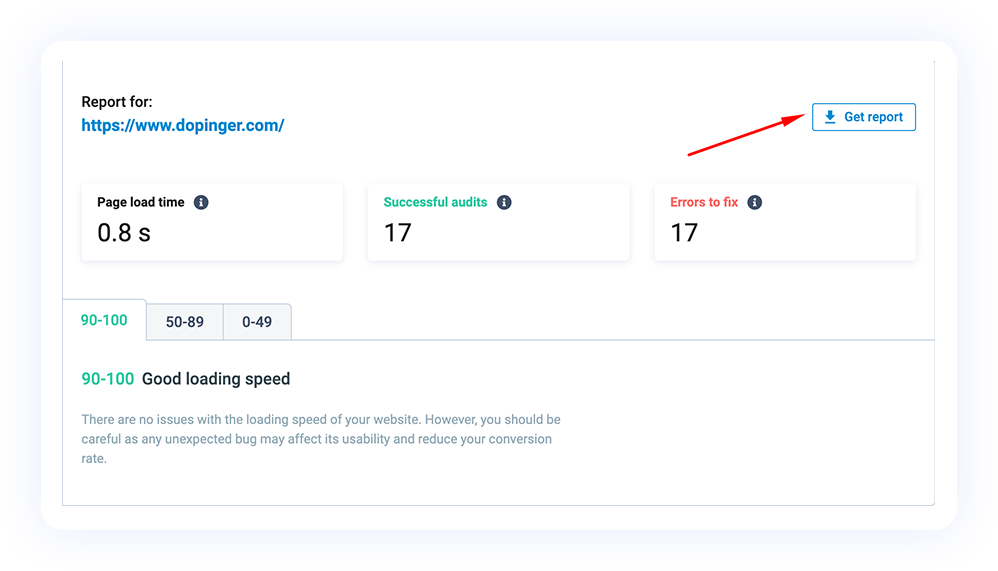
Right next to the mobile and desktop speed score, there is a page loading time, successful audits and errors to be fixed section.
Page load time refers to the time it takes for the web page to be ready for interaction. This time is expressed in seconds. Less than 3 seconds is considered a better value.
Successful audits show successful applications on your website in numbers. Here, your successful applications that will positively affect the speed of your website are shown.
It provides information about errors to be fixed, negative practices that slow down the speed of your website, and what needs to be done. You can see the features you need to fix to increase your website speed.
See Your Website's Errors
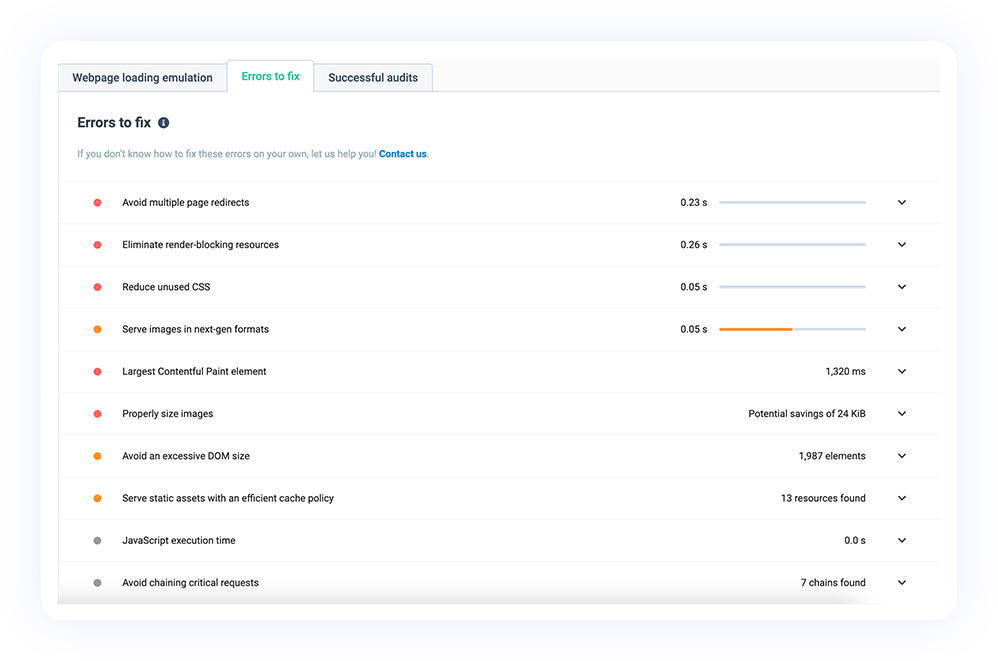
If you measure with a website tester, you can see errors on your website that affect the current site speed. Dopinger site speed monitoring tool identifies some features that negatively affect the speed of your website. Here you can review errors separately for mobile and desktop devices.
You can see these errors in the “Fixing Errors” section. In this section, the errors found on your website are listed one by one. Each error is colored green, red and orange. You do not need to make any corrections for green colours. It is stated that if you make the suggested changes in orange colors, your site speed may increase. You definitely need to edit red colored errors.
In the error-related section, when you click on an error in the error list, what the error is is explained in detail. For example, if there is an error in the first response time, it is stated how long the time was. Then, at the top there are suggestions and guidance on how to fix the relevant error. At the end of the suggestion regarding the solution to the error, you can click on the blue icon to get more information about the relevant error and correction.
When you click on the blue expression, it directs you to the relevant resource of the largest search engine, Google. With the control in this tool, you can see the errors that slow down the speed of your website, get solution suggestions, and directly access the page regarding Google's instructions on this subject.
If you are looking for a professional solution to the problems listed in the errors to be fixed section, you can contact Dopinger directly from the "Contact Us" button at the top.
Get Report of Your Website Speed Test
Dopinger site speed test tool tests the current opening speed of your website. It allows you to see how the opening speed is in terms of search engines and any existing errors. You can download the evaluation results made by the website testing tool as a report.
To get a report, simply click the "Get Report" button at the top right of the screen. You can get a PDF report here without paying. In this report you can find all existing errors and successful audits.
The tool gives you the report in PDF, TXT and CSV formats. You must be a member to receive reports from the tool. You can become a member by clicking on the membership button and selecting your e-mail address and password. You can then become a member by activating your e-mail address. The membership process for the Dopinger site speed test tool is free.
After logging in, you can download the detailed PDF report for free. Once you become a member, you can test as many site speeds as you want with the testing tool. As a result of the analysis, you can get professional support to increase the opening speed of your site. Use our tool now and check website speed.
Other Free Dopinger SEO Tools
Dopinger offers free SEO tools to analyze your websites and create strategies to increase their performance. Here are the tools that we offer that can give a boost to your websites:
Website Speed Test F.A.Q.
Click the questions to see frequently asked questions and their answers.
Is Website Speed Test Tool Data Accurate?
How Do I Interpret Dopinger Site Speed Test Tool Results?
Should I Pay to Test My Site's Speed?
Can I Receive Test Results as a Report?
What Information Should I Provide to Test Site Speed?
What's in Website Speed Test Results?


